IC Markets Home Sign in Web Trader Contact Us
IC Markets Social IC Markets Social

Information Hub for
Serious Traders

  • ABOUT US
  • OPEN LIVE ACCOUNT
  • OPEN DEMO ACCOUNT
  • TRADE NOW
  • VISIT OUR BLOG
IC Markets Social
  • ABOUT US
  • OPEN LIVE ACCOUNT
  • OPEN DEMO ACCOUNT
  • TRADE NOW
  • VISIT OUR BLOG
June 23, 2022North_American_Stocks_ptIC Markets

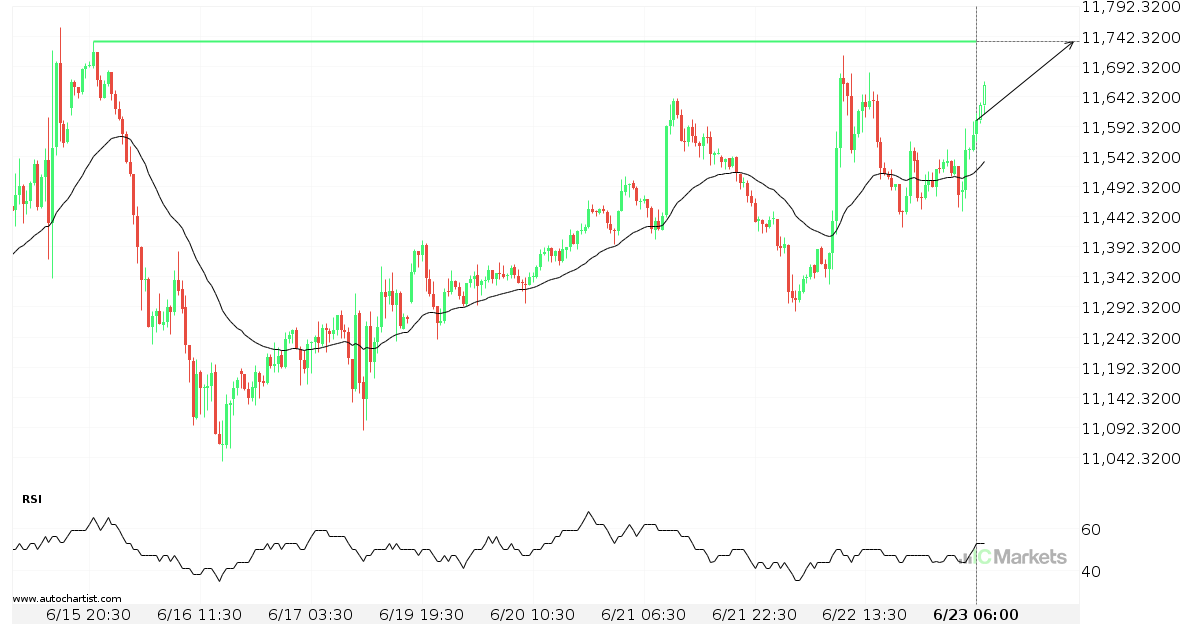
Breach of important price line imminent by US Tech 100 Index

US Tech 100 Index is moving towards a line of 11733.7998 which it has tested numerous times in the past. We have seen it retrace from this position in the past, so at this stage it isn’t clear whether it will breach this price or rebound as it did before. If US Tech 100 Index […]

Read more
June 22, 2022North_American_Stocks_ptIC Markets

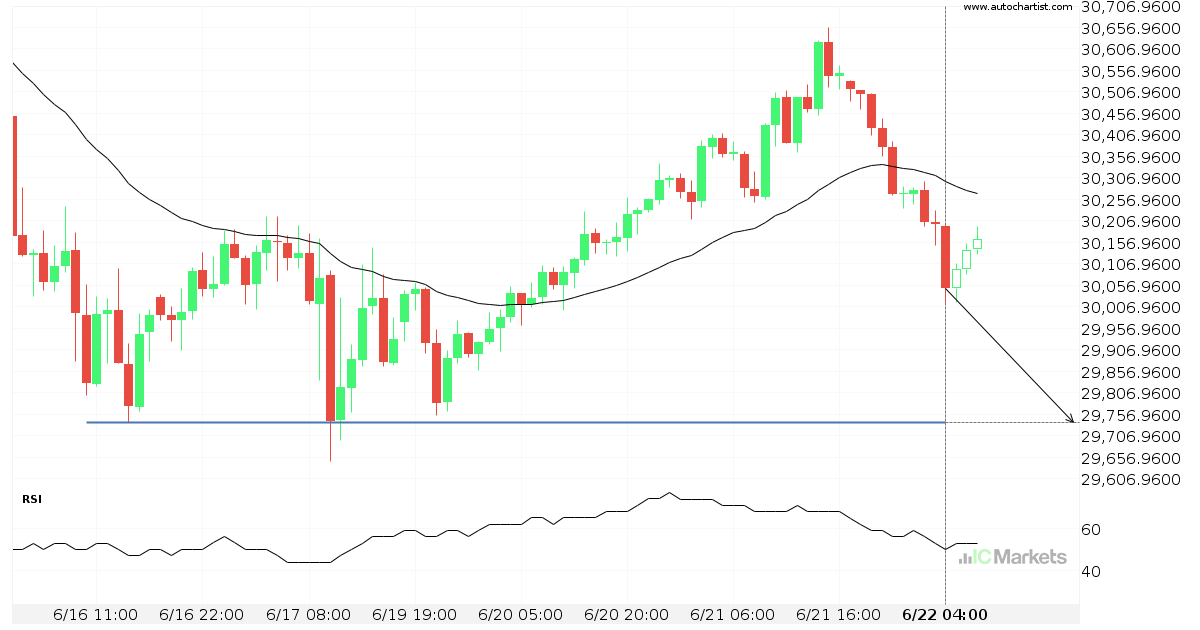
Breach of important price line imminent by US Wall Street 30 Index

US Wall Street 30 Index is moving towards a line of 29736.8008 which it has tested numerous times in the past. We have seen it retrace from this position in the past, so at this stage it isn’t clear whether it will breach this price or rebound as it did before. If US Wall Street […]

Read more
June 21, 2022North_American_Stocks_ptIC Markets

What’s going on with AbbVie?

Those of you that are trend followers are probably eagerly watching AbbVie to see if its latest 11,2% move continues. If not, the mean-reversion people out there will be delighted with this exceptionally large 34 days move.

Read more
June 20, 2022North_American_Stocks_ptIC Markets

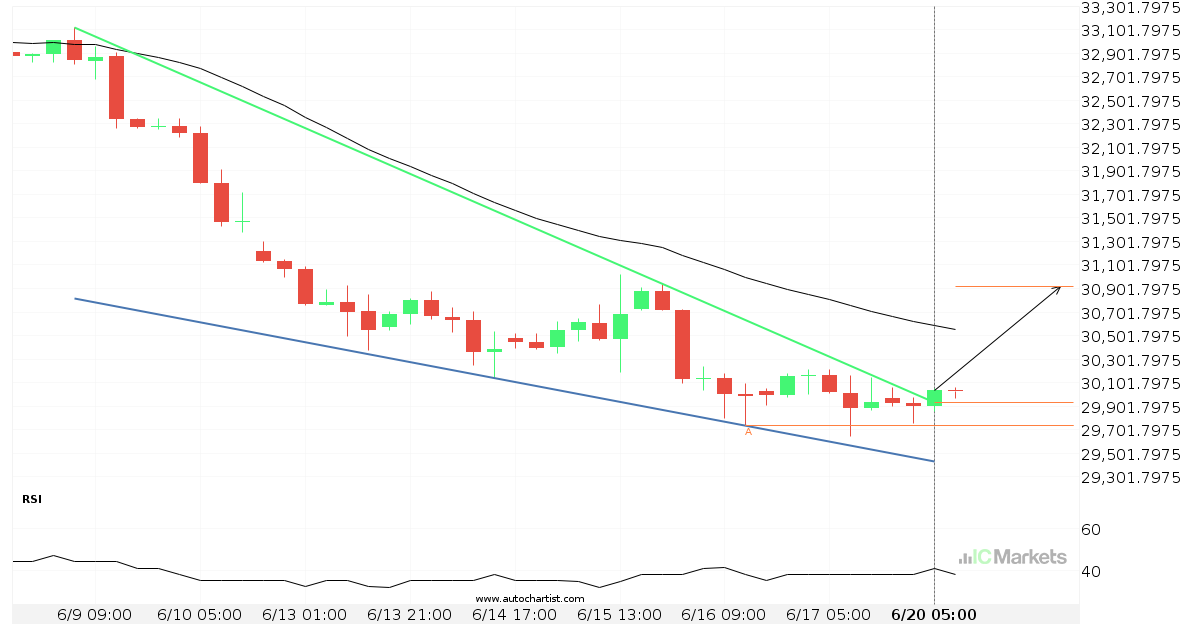
US Wall Street 30 Index has broken through resistance

US Wall Street 30 Index has broken through a resistance line. It has touched this line at least twice in the last 12 days. This breakout may indicate a potential move to 30918.2372 within the next 3 days. Because we have seen it retrace from this position in the past, one should wait for confirmation […]

Read more
June 17, 2022North_American_Stocks_ptIC Markets

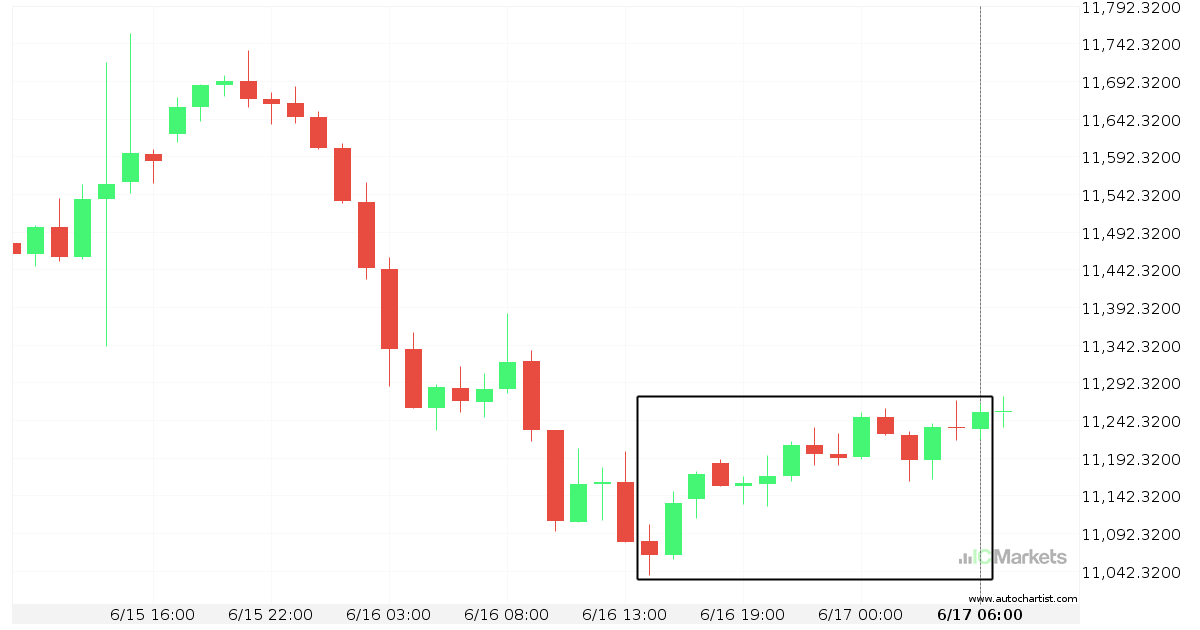
Huge bullish move on US Tech 100 Index

US Tech 100 Index has moved higher by 1,71% from 11.080,9 to 11.252,9 in the last 16 hours.

Read more
June 16, 2022North_American_Stocks_ptIC Markets

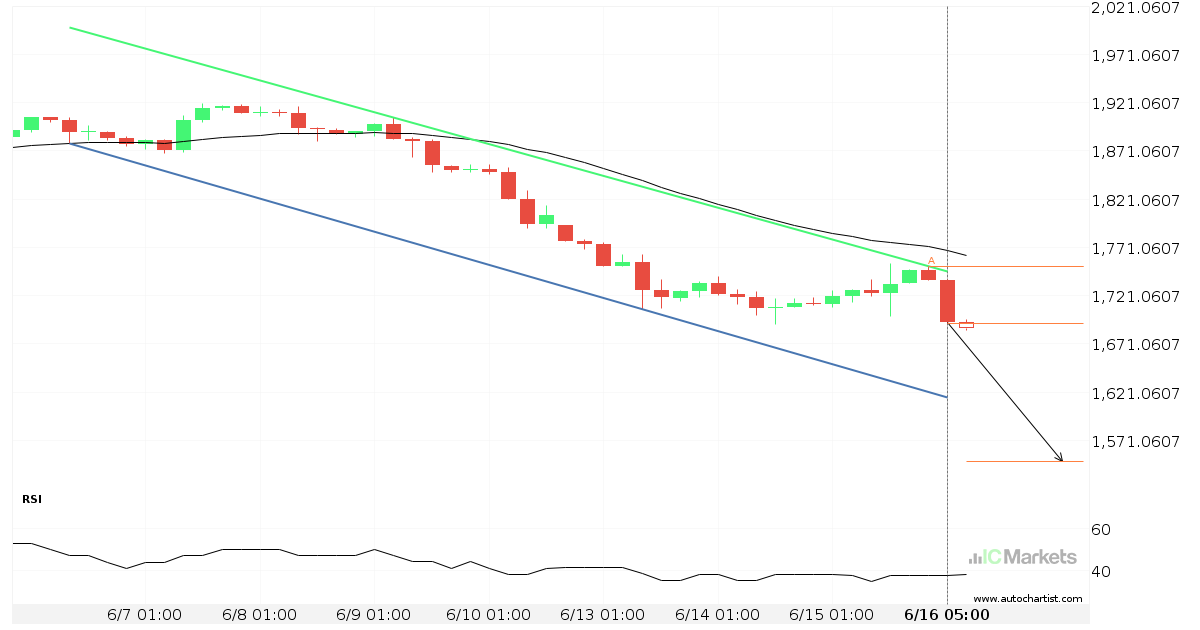
Will US Small Cap 2000 Index have enough momentum to break support?

US Small Cap 2000 Index is heading towards the support line of a Canal descendente and could reach this point within the next 3 days. It has tested this line numerous times in the past, and this time could be no different from the past, ending in a rebound instead of a breakout. If the […]

Read more
June 15, 2022North_American_Stocks_ptIC Markets

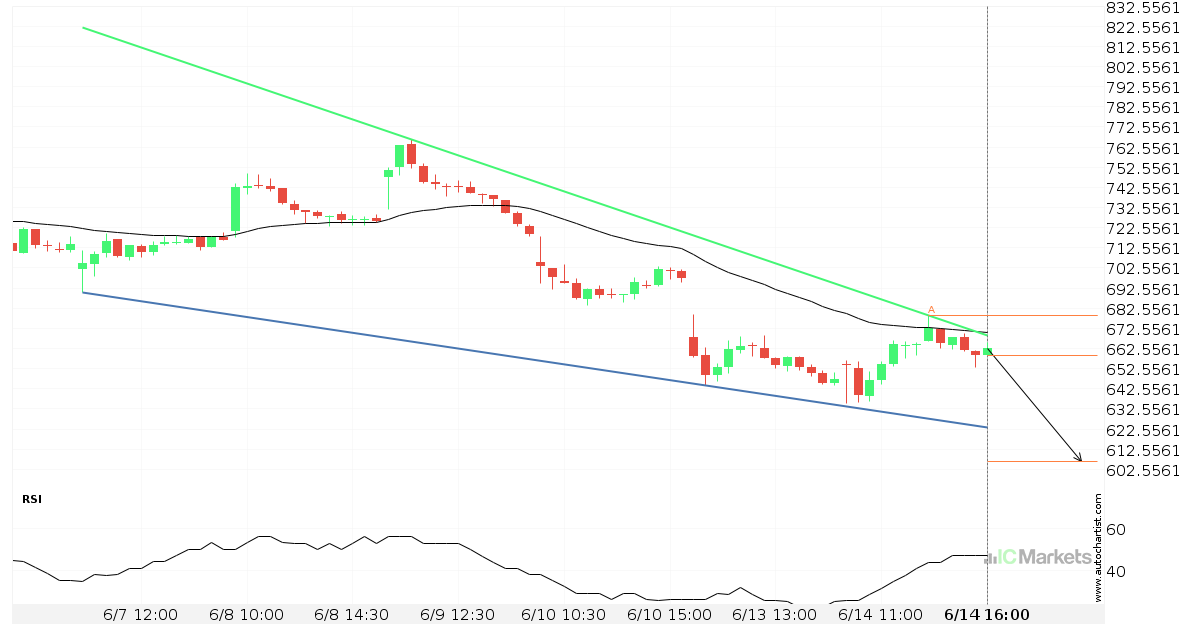
Tesla Inc. approaching support of a Cunha descendente

Tesla Inc. is approaching the support line of a Cunha descendente. It has touched this line numerous times in the last 8 days. If it tests this line again, it should do so in the next 12 hours.

Read more
June 14, 2022North_American_Stocks_ptIC Markets

What’s going on with Microsoft Corporation?

Those of you that are trend followers are probably eagerly watching Microsoft Corporation to see if its latest 10,49% move continues. If not, the mean-reversion people out there will be delighted with this exceptionally large 5 days move.

Read more
June 13, 2022North_American_Stocks_ptIC Markets

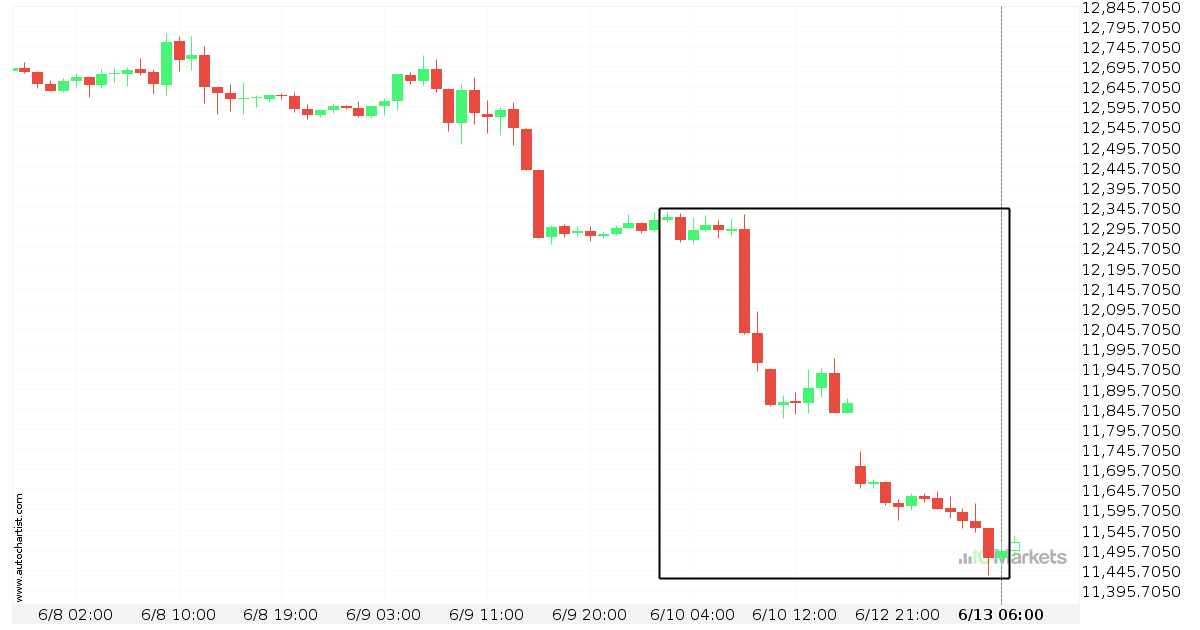
What’s going on with US Tech 100 Index?

Those of you that are trend followers are probably eagerly watching US Tech 100 Index to see if its latest 6,73% move continues. If not, the mean-reversion people out there will be delighted with this exceptionally large 4 days move.

Read more
June 10, 2022North_American_Stocks_ptIC Markets

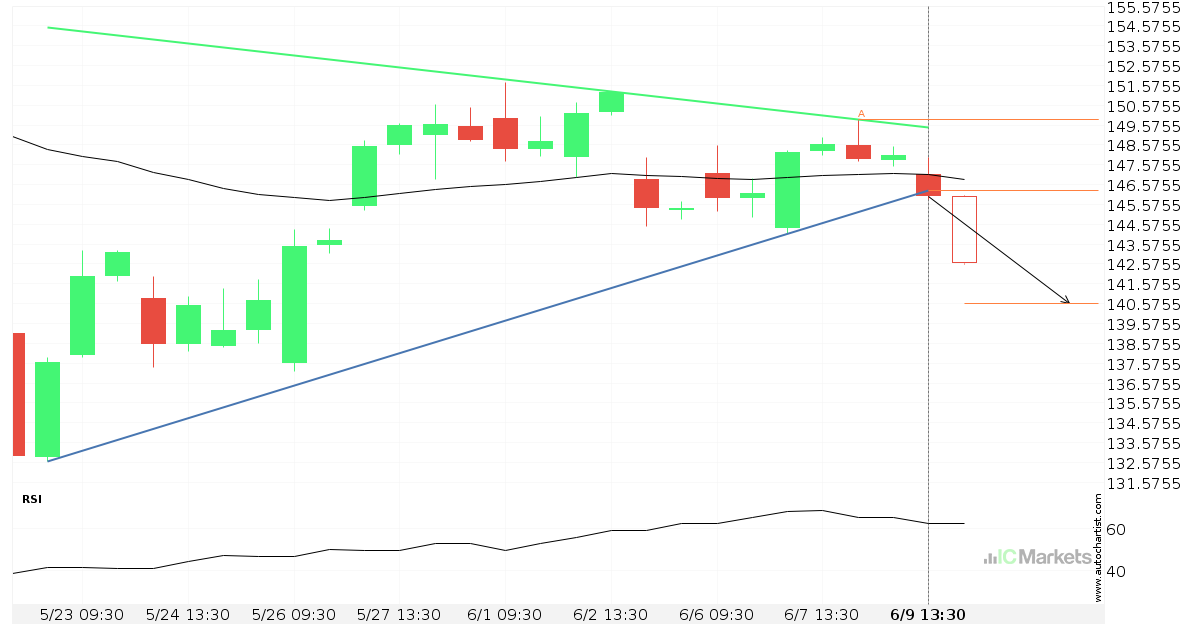
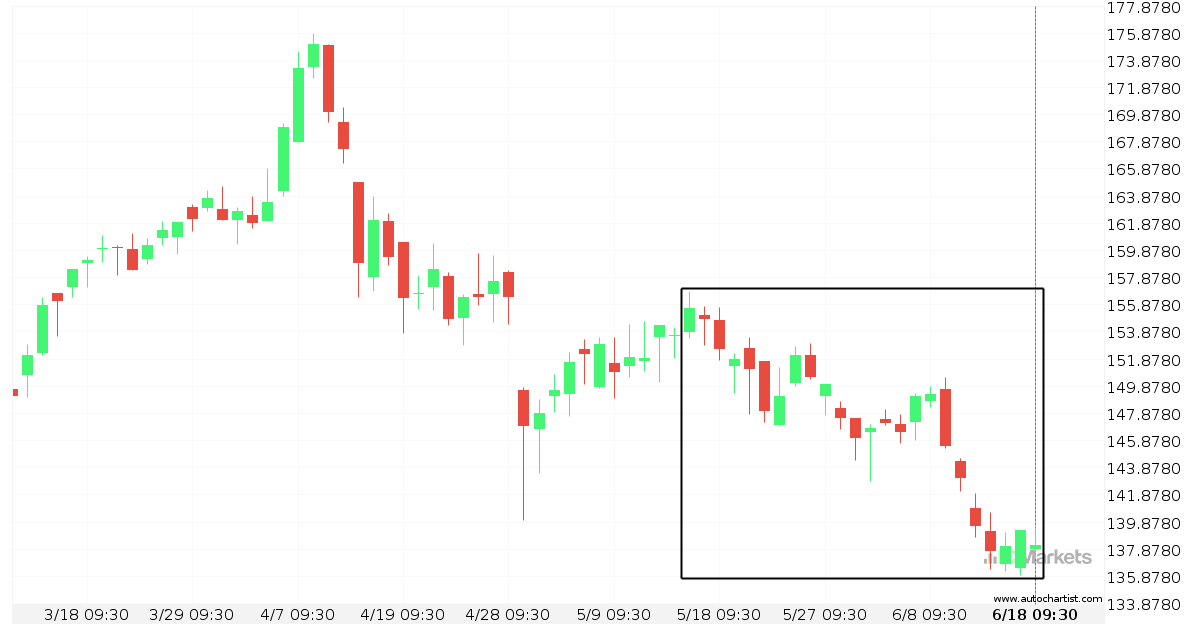
Apple Inc. has broken through support

Apple Inc. has broken through a support line. It has touched this line at least twice in the last 21 days. This breakout may indicate a potential move to 140.6070 within the next 2 days. Because we have seen it retrace from this position in the past, one should wait for confirmation of the breakout […]

Read more
  • 1
  • 2
  • 3
  • …
  • 53
  • 54
  • 55
  • 56
  • 57
  • 58
  • 59
  • …
  • 87
  • 88
  • 89

Recent Posts

  • Brent Oil vs US Dollar – نموذج الرسم البياني – قناة صاعدة
  • Brent Oil vs US Dollar – نموذج الرسم البياني – قناة صاعدة
  • Hong Kong 50 Index – نموذج الرسم البياني – مثلث صاعد
  • Hong Kong 50 Index – รูปแบบกราฟ – สามเหลี่ยมขาขึ้น
  • Hong Kong 50 Index – نموذج الرسم البياني – مثلث صاعد

Recent Comments

    Translation


     Edit Translation

    Trade with

    a market leader you can rely on

    Open Trading Account Try a Free Demo

    Forex Trading

    • Accounts Overview
    • Open an Account
    • Launch Web Trader

    Trading Specifications

    • Spreads and Commissions
    • Range of Market
    • Trading Hours
    • Funding
    • Withdrawal

    About IC Markets

    • Help Center
    • Why IC Markets
    • Regulation
    • Legal Documents
    • Contact Us


    Forex Trading

    • Accounts Overview
    • Open an Account
    • Launch Web Trader

    Trading Specifications

    • Spreads and Commissions
    • Range of Market
    • Trading Hours
    • Funding
    • Withdrawal

    About IC Markets

    • Chat with a Specialist 24/7
    • Why IC Markets
    • Regulation
    • Legal Documents
    • Contact Us

    Disclaimer: This material is marketing material where all marketing material is published for informational purposes only. This material does not contain and should not be considered as containing - investment advice and recommendations, or suggestions for performing any actions with financial instruments. The built-in widgets belong to their external independent authors, and IC Markets is not responsible for their content and their impact on trade.

    All content rights reserved. Opinions of the authors may not coincide with the opinion of the blog editors. When copying materials from this site or connecting to an RSS feed to republish our articles, a link to IC Markets or attribution in the format ‘IC Markets Blog’ is required. For general questions, please contact the editorial office via the form on the Contact us page.

    Risk Warning: Trading Derivatives carries a high level of risk to your capital and you should only trade with money you can afford to lose. Trading Derivatives may not be suitable for all investors, so please ensure that you fully understand the risks involved and seek independent advice if necessary. A Product Disclosure Statement (PDS) should be considered before entering into a transaction with us.

    The contents of this page are general information only and does not take into account your personal situation, financial objectives or needs. It is up to you to make sure the products that we offer suit your specific needs. You should not trade with us unless you understand the features and risks of the products that we offer. This means that you might need to seek independent advice before you start trading with us.

    © 2022 Raw Trading Ltd | All rights reserved.
    • Sample Page